Feature
Follow-Through Day Detection
TradersLab tracks follow-through days on the Nasdaq and S&P 500 the way institutions read them: count the days from the low, and watch for a session that gains at least 1.25% on heavier volume. It is the confirmation that a bounce has turned into a rally worth trading — and the place to time re-entry after a correction.
What a follow-through day is
A follow-through day is the point where a beaten-down market shows the first real evidence that sellers have been overwhelmed by buyers. It is defined precisely: counting from the first up day off the low, a session where the index gains 1.25% or more on volume heavier than the day before.
Both halves matter. Any bounce can produce a couple of up days on light volume — what it cannot fake is a decisive gain on rising volume, because that requires institutions buying size. The volume is what separates a real turn from a dead-cat bounce.
The day count is the discipline
The count starts with the rally attempt, not the low itself. The low sets the line in the sand: if a later session trades beneath it, the attempt is dead and the count resets. Day 1 is the first session that closes up off that low, or that reverses to close in the upper half of its range.
Days 2 and 3 are too early to confirm anything — every failed bounce produces up days there. From Day 4 the follow-through can arrive, and days 4 through 7 carry the most weight: early enough that you are still buying near the low, late enough that the bounce has proven it can hold. Confirmations do land later, and TradersLab flags those separately as late confirmations so you can size the signal for what it is rather than treating a day-12 signal like a day-5 signal.
The follow-through day dashboard
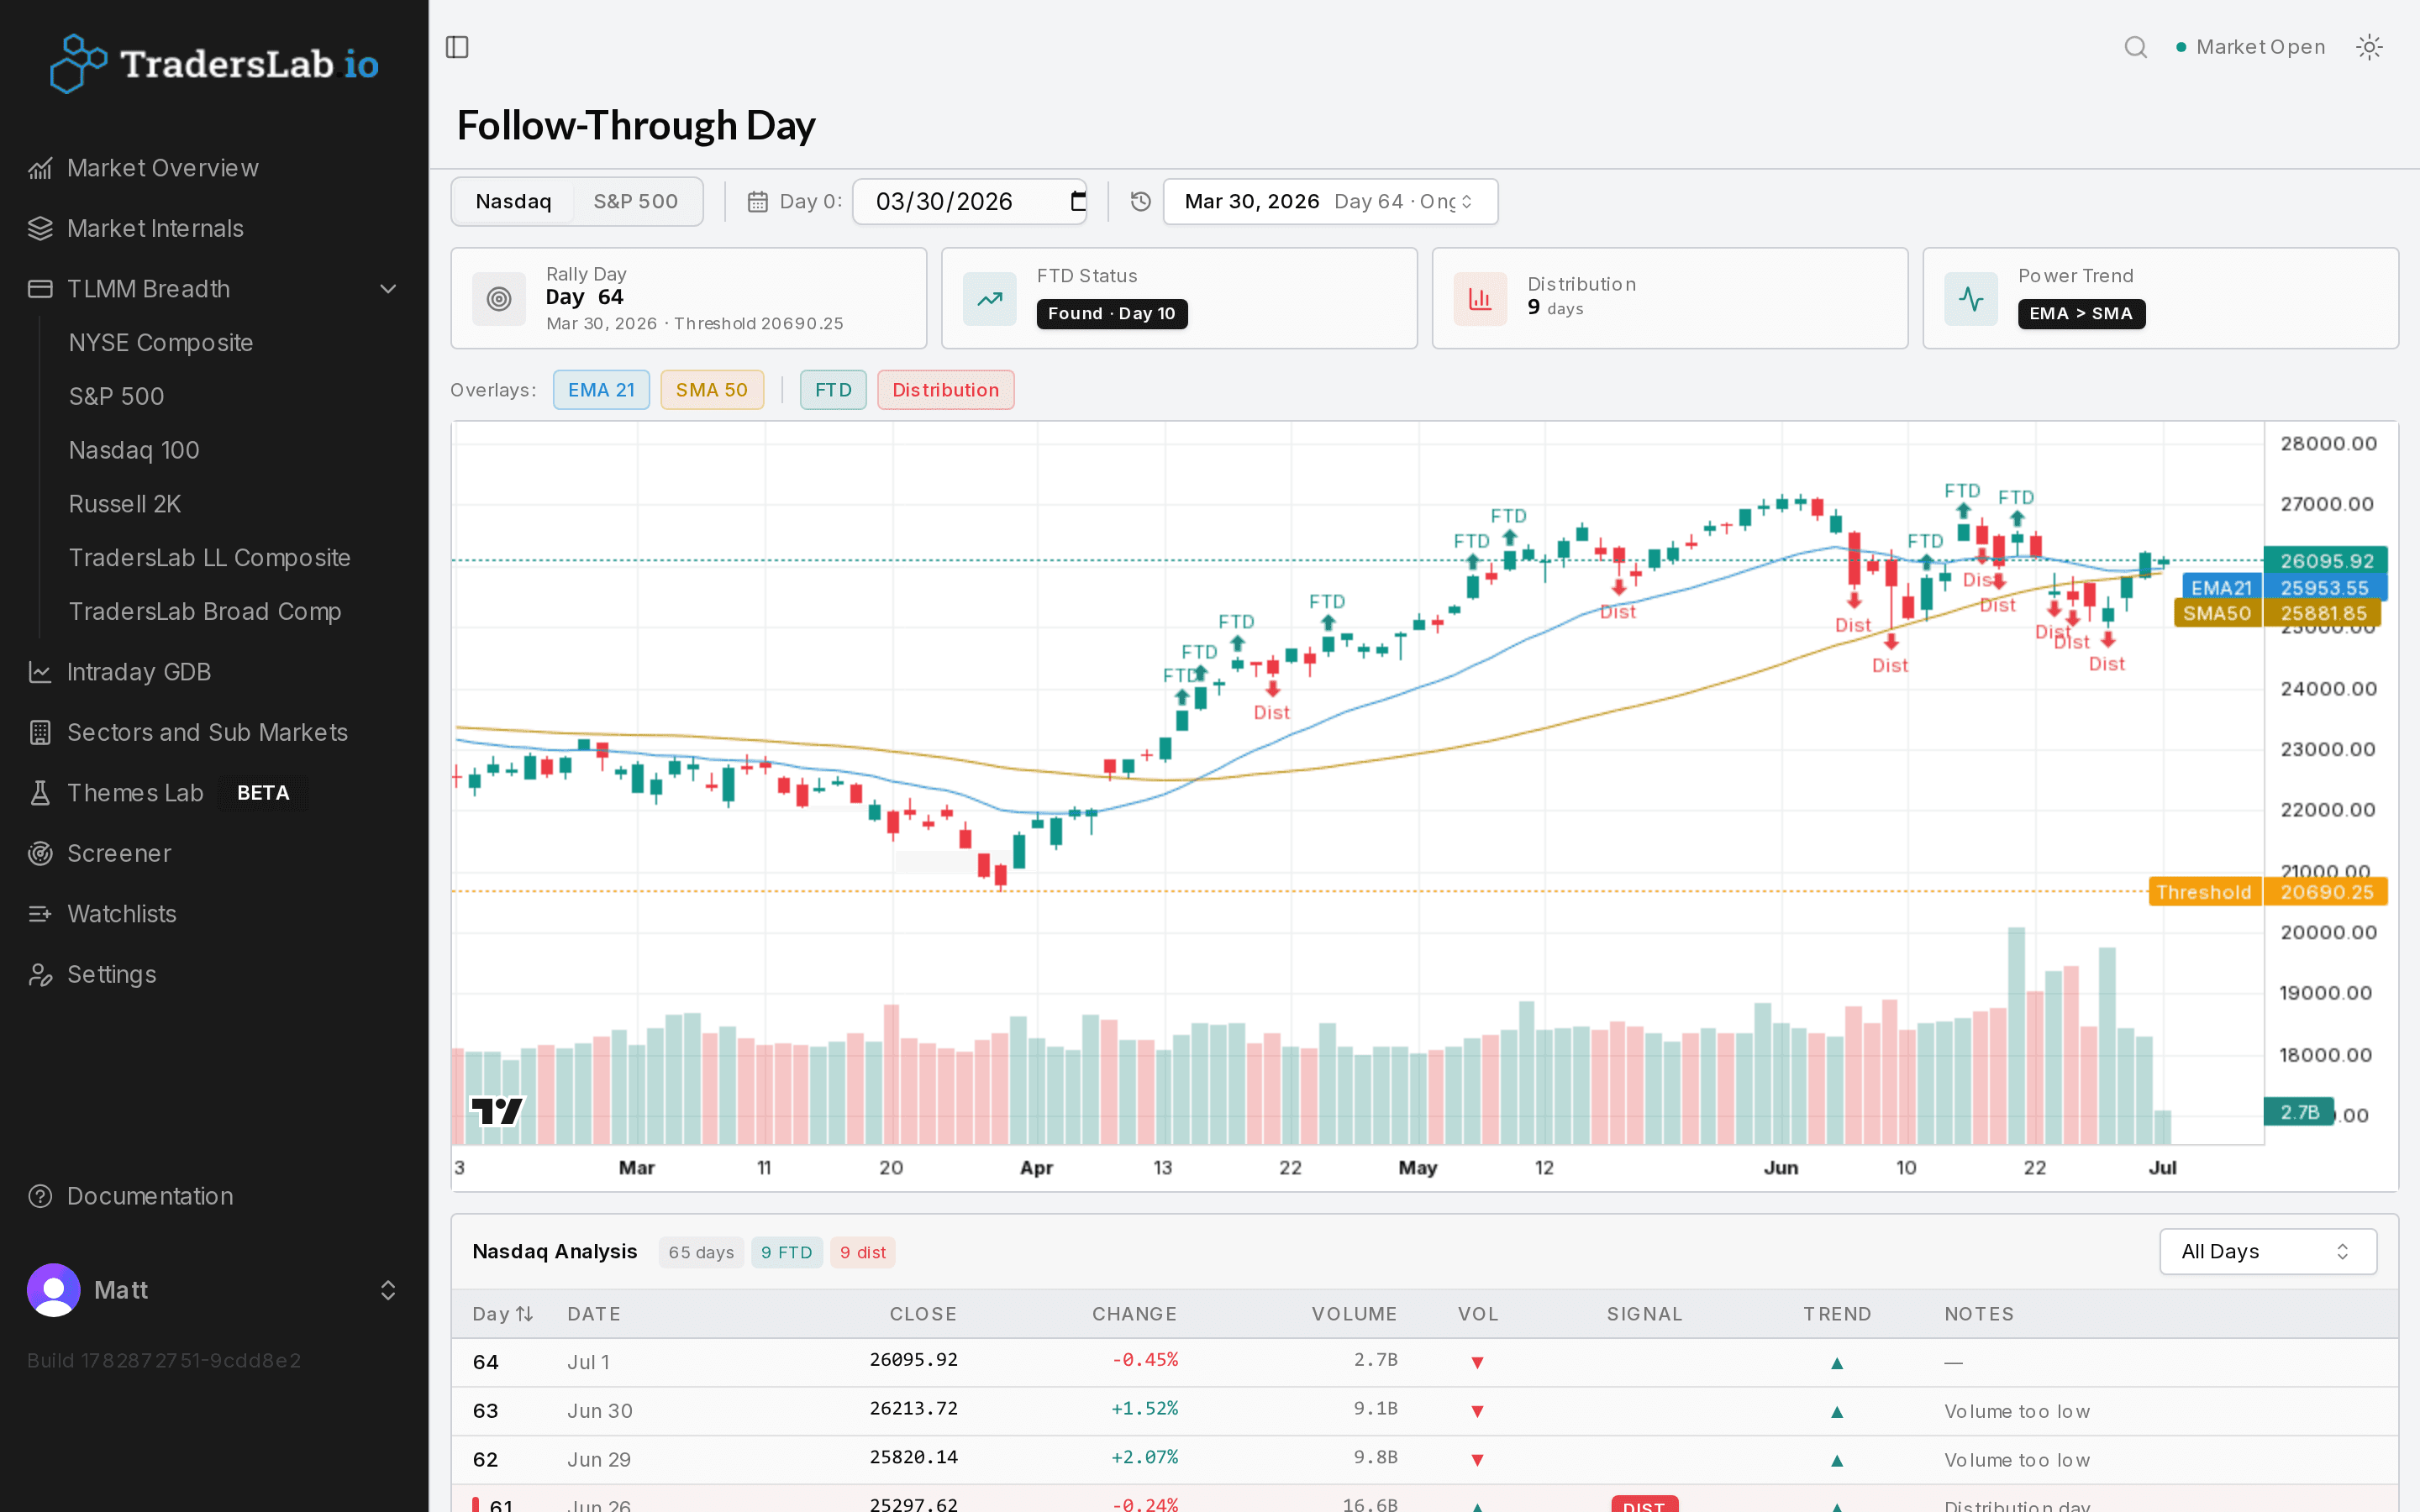
The dashboard runs on both the Nasdaq Composite and the S&P 500. A rally-day counter marks the low as Day 0 and tracks the attempt from Day 1, so you always know how far in the market is, and an FTD Status indicator tells you at a glance whether the rally is confirmed, confirmed late, or still unconfirmed.
Alongside it, a rolling distribution count tracks institutional selling pressure — sessions closing down more than 0.2% on heavier volume. Days drop out of the count as they age past five weeks or once the index closes 5% above them, so the number reflects pressure on the rally now rather than a running total. Around five or six active days is where a confirmed rally starts to look tired.
A Power Trend state summarizes the regime. It turns on only when the 21-day EMA has held above the 50-day SMA for at least five sessions, the 50-day SMA is higher than it was a month ago, and the index has stayed above its 21-day EMA for at least ten sessions — and it switches off when the 21-day loses the 50-day. The chart shows all of it: the 21 EMA and 50 SMA overlays, plus markers on price for each follow-through and each distribution day.
Pairing it with breadth
A follow-through day tells you the index moved decisively on volume. Breadth tells you how many stocks came with it. The Global Daily Breadth (GDB) score rolls the session's internals — advance/decline, up/down volume, net new highs and the 4% up/down momentum ratio — into a single reading normalized from -100 to +100 against the past year.
A follow-through day that lands alongside a strong GDB reading is a materially better signal than one where the index rose but participation stayed narrow. Intraday GDB lets you watch that participation build through the session instead of waiting for the close, and comparing it across the NYSE Composite, equal-weight S&P 500, equal-weight Nasdaq 100 and Russell 2000 shows which index is leading the recovery.
Used together the two answer different questions: the follow-through day tells you when to act, breadth tells you how much to trust it.
Who it's for
- Swing traders looking to time re-entry after a market correction or downtrend
- Trend traders who want breadth confirmation before trusting a bounce as a real bottom
- Active traders who watch market internals in real time to catch the turn early
Frequently asked questions
What is a follow-through day?
A session where a major index gains at least 1.25% on heavier volume than the day before, counted from the first up day off the low. It signals that institutions have stepped back in and a new uptrend may be starting. Days 4 through 7 of the rally attempt carry the most weight.
How does TradersLab track a market bottom?
It counts the rally attempt from the low, marks Day 1 as the first session closing up off it, and watches for a qualifying gain on rising volume from Day 4 onward. If the index trades back below the original low the attempt fails and the count restarts. Confirmations after day 7 are flagged separately as late.
Does a follow-through day guarantee a new uptrend?
No — some fail within days. But nearly every major market bottom produced one, so waiting for the confirmation filters out the thin, failing bounces that typically come first. It shifts the odds in your favor rather than guaranteeing the outcome, which is why the dashboard also tracks distribution days and the Power Trend.
How does market breadth fit in?
A follow-through day tells you the index moved on volume; the Global Daily Breadth score tells you how broadly that move was supported across advancers, up-volume, new highs and 4%-up momentum. A follow-through backed by strong breadth is a far better signal than one where participation stayed narrow, and Intraday GDB lets you watch that build before the close.
Related reading
See it on live market data
Start free and explore follow-through day with real-time data.