Feature
Market Breadth Dashboard
TradersLab's market breadth dashboard puts advances/declines, up/down volume, new highs/lows, the McClellan indicators and the percentage of stocks above key moving averages in one view — so you can tell whether a market move is backed by broad participation or just a handful of stocks.
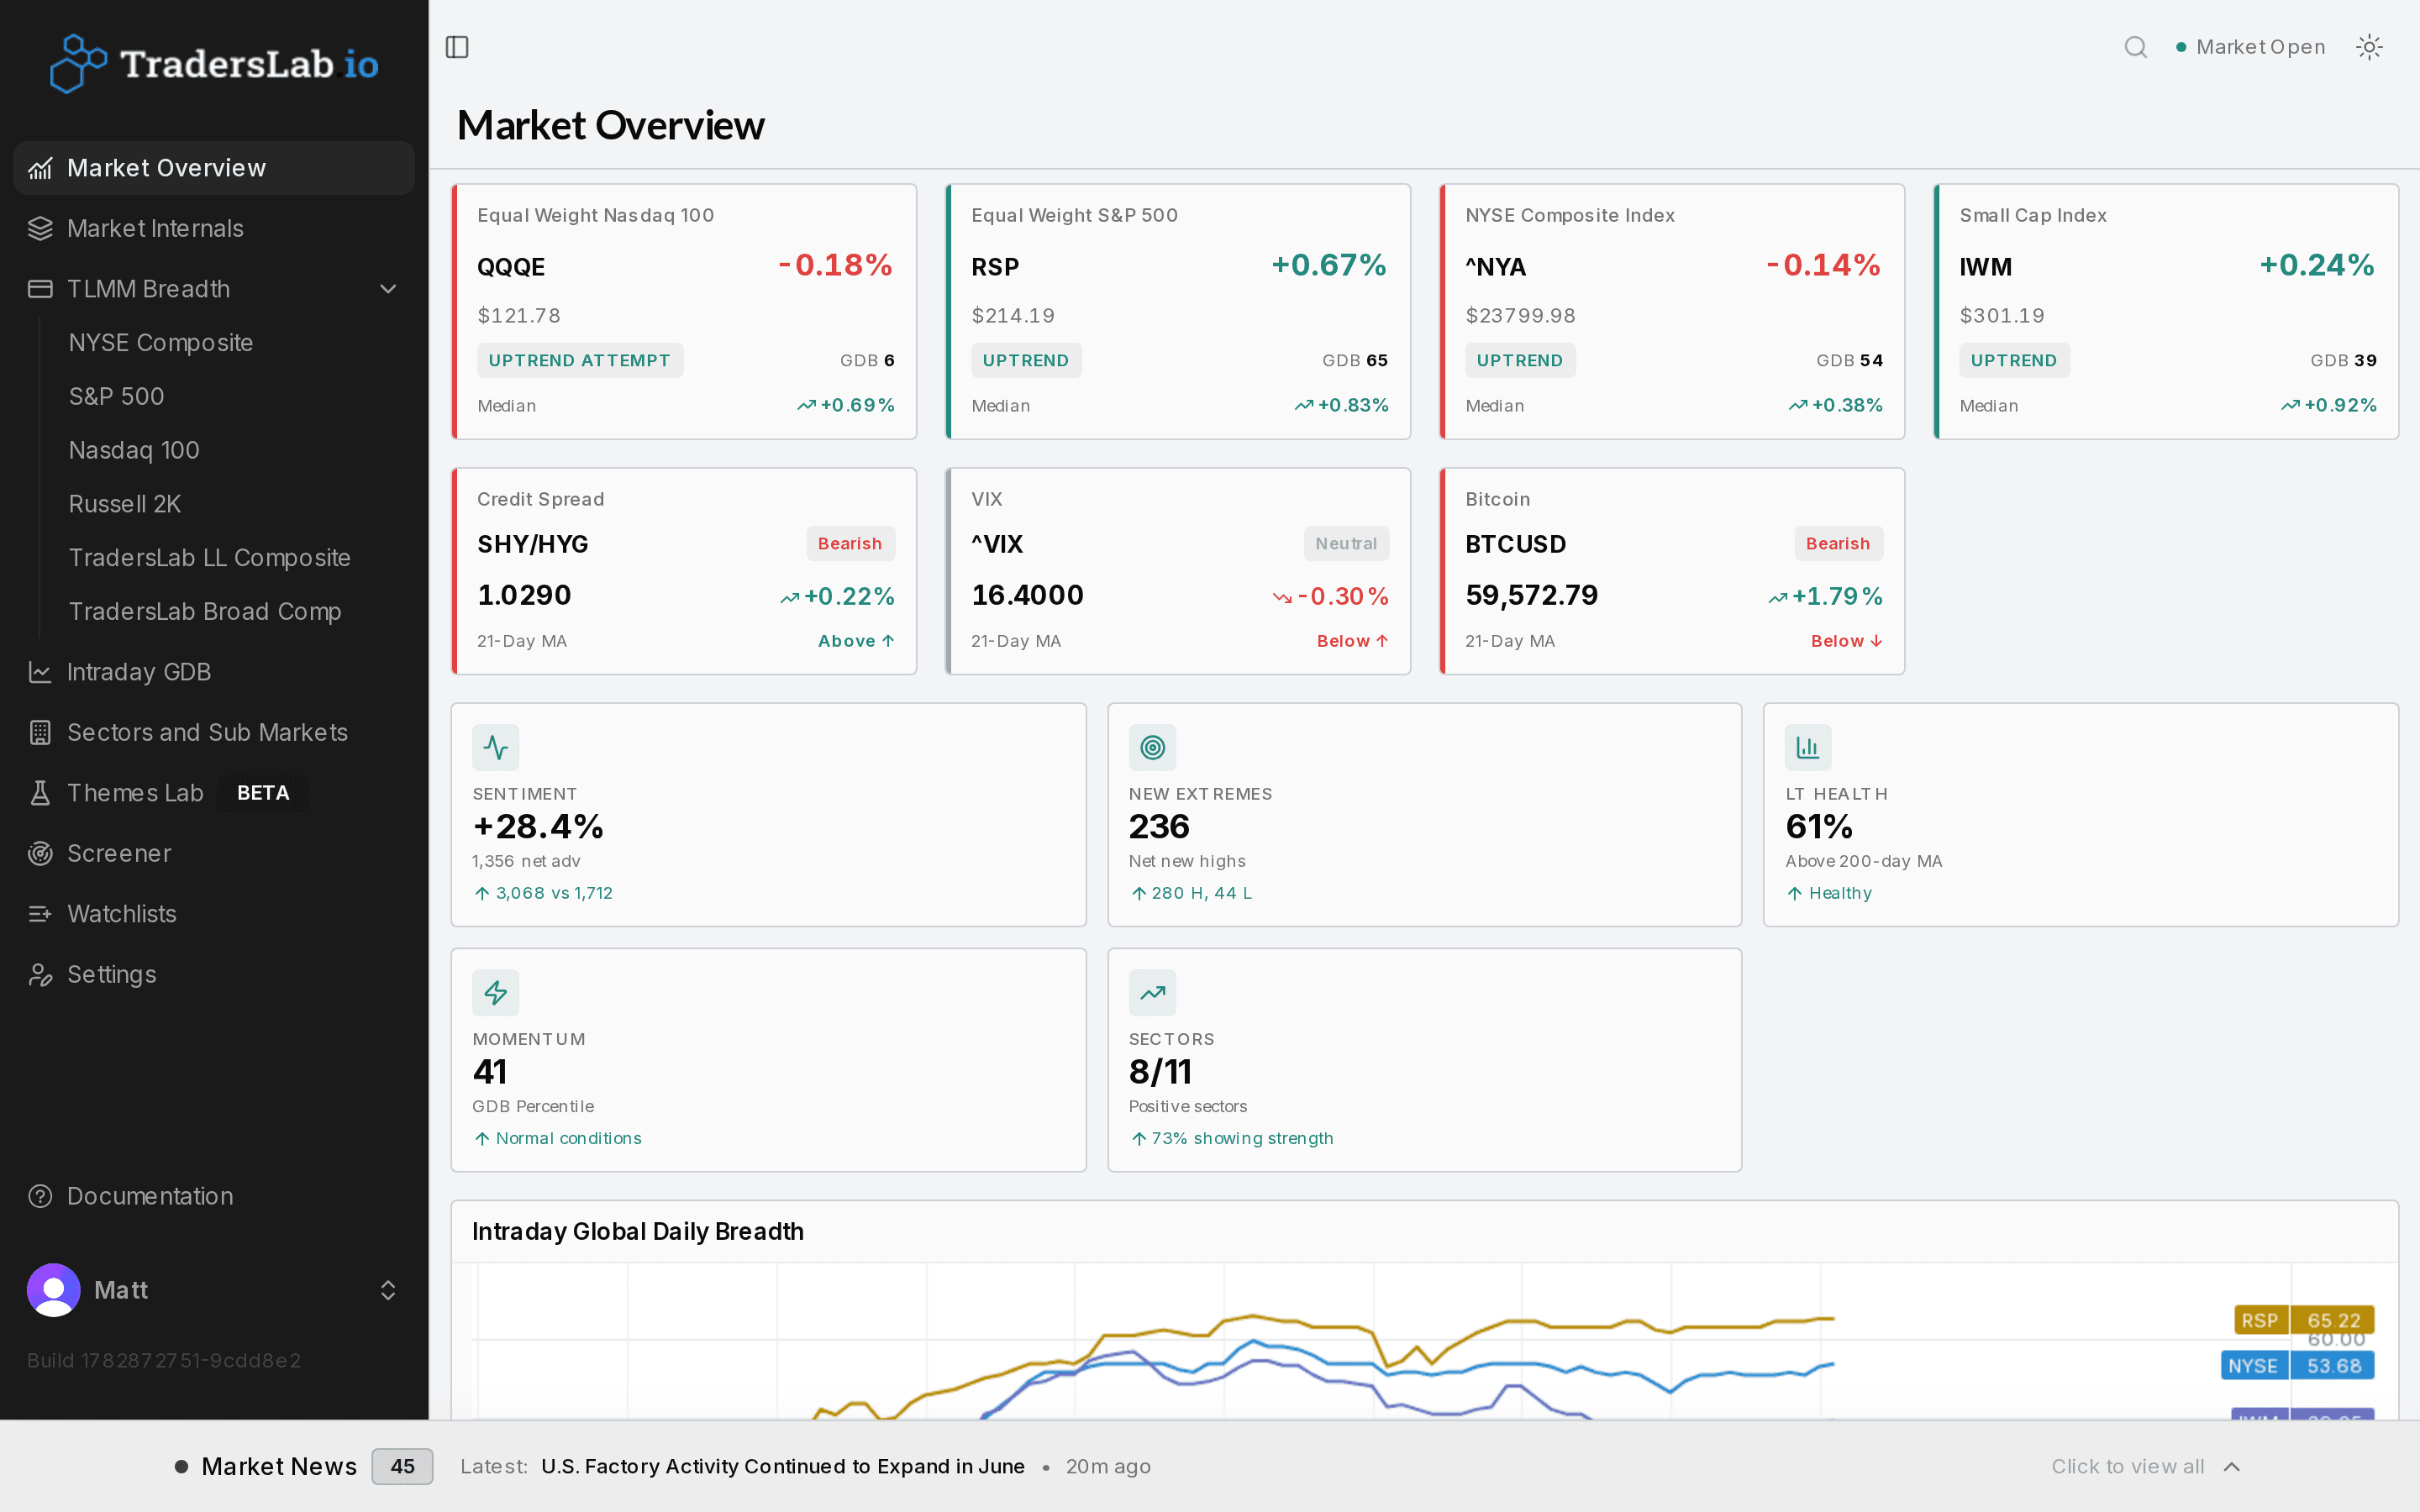
One screen for the health of the market
The Market Overview is the top-of-funnel snapshot inside TradersLab, pulling the most decision-relevant market data into one place. Along the top sit the major broad-market gauges — the NYSE Composite (^NYA), the equal-weight S&P 500 (RSP), the equal-weight Nasdaq 100 (QQQE) and small caps (IWM) — each shown with its price level, daily percentage move and a trend-condition label such as Pullback or Correction. Equal-weight proxies are used deliberately so mega-cap concentration doesn't mask what the average stock is doing.
Beneath the headline indices, risk and sentiment tiles frame the macro backdrop: a credit spread gauge (SHY vs. HYG), the VIX measured against its 21-day moving average, and Bitcoin as a speculative-appetite proxy. A widening SHY/HYG spread flags risk-off conditions as an early defensive warning, while the VIX below its 21-day MA reads as a neutral-to-bullish backdrop.
The breadth indicators that matter
The dashboard turns raw internals into readable signals. Market Sentiment reads daily advance/decline breadth; New Extremes counts new 21-day highs versus lows to show whether participation is expanding or deteriorating; Long-Term Health tracks the percentage of stocks above their 200-day average, where roughly 50% is a healthy broad uptrend and below 50% signals weakening. Breadth Momentum is a z-score-normalized read of the McClellan Oscillator and Summation Index — the McClellan Oscillator being the difference between the 19-day and 39-day EMAs of net advances — where a high positive value is a momentum thrust and a deep negative is oversold and washed-out.
Sector Strength counts how many of the 11 GICS sectors are positive: more than 7 signals broad strength and a higher-probability trend, while fewer than 4 signals narrow leadership and higher false-breakout risk. A full breadth engine sits behind these tiles — cumulative 52-week high/low lines, up/down volume, and a Percent of Stocks Above Key Moving Averages panel spanning the 5-, 10-, 21-, 50- and 200-day averages. On the 21 EMA, below 25% reads oversold and above 75% overbought.
Daily and intraday Global Daily Breadth
The Global Daily Breadth section turns quantitative breadth into visuals — a sector-distribution bubble chart, an intraday GDB chart and a returns view — all toggleable across the S&P 500, Nasdaq 100, Russell 2000 and NYSE universes. Intraday GDB is the live, continuously updating version of the measure: where traditional breadth tools only report at the close, it refreshes throughout the session so you can watch internals evolve in real time.
A positive intraday reading signals broad upside participation and a more sustainable rally; a negative reading means decliners outweigh advancers and downside risk is rising. Because the same reading is computed for several indices at once, you can compare breadth across markets and watch for divergences — price rising while GDB falls warns of exhaustion, price falling while GDB improves hints at accumulation. A Daily Market Breadth Snapshot table repeats the reads (ADV, DECL, NET, new highs/lows and % above each moving average) for every market and sector, with clickable rows that open a mini price chart.
AI Insights: a plain-English read of the internals
On top of the raw numbers, TradersLab layers an AI Insights read that interprets the market for you. On the Market Internals dashboard it generates a plain-English narrative — with an overall stance such as bullish, mixed or risk-off — that ties the day's cross-asset signals together: crude oil and the VIX, credit spreads (SHY vs. HYG), intermarket ratios like technology versus staples (XLK/XLP), and gold. Instead of leaving you to connect a dozen separate gauges, it spells out what they mean as a whole and points to the specific levels worth watching.
It distills each read into a few key tells — the one or two conditions most likely to decide the next move — and refreshes on demand as conditions change. The same AI Insights read is also available from the TLMM dashboard, so the interpretation sits right next to the breadth data it's drawn from.
Who it's for
- Swing and momentum traders who want a fast, one-screen read on market conditions before drilling into names
- Traders who use internals to judge whether a move is broad or narrow before adding exposure
- Day and intraday traders who need live breadth confirmation beneath price action, not end-of-day signals
Frequently asked questions
What does the TradersLab market breadth dashboard show?
It summarizes the state of the market on one screen: broad-market indices with trend tags, risk tiles (credit spread, VIX, Bitcoin), and internal breadth reads including advance/decline sentiment, new highs/lows, percent of stocks above the 200-day average, a normalized breadth-momentum score and the count of positive GICS sectors — plus daily and intraday Global Daily Breadth charts.
What percentage of stocks above the 200-day moving average signals a healthy market?
Roughly 50% of stocks above their 200-day average reads as a healthy broad uptrend; below 50% points to a weakening or corrective market. On the shorter-term 21 EMA panel, below 25% is oversold and above 75% is overbought.
How many sectors positive counts as broad market strength?
TradersLab counts how many of the 11 GICS sectors are positive. More than 7 positive sectors signals broad strength and a higher-probability trend; fewer than 4 signals narrow leadership and a higher risk of false breakouts.
How is intraday market breadth different from end-of-day breadth?
Traditional breadth tools only report at the close. Intraday GDB is the live version of the Global Daily Breadth measure and refreshes continuously through the session, so you can confirm whether a move is backed by broad participation in real time instead of waiting for end-of-day.
Does TradersLab use AI to interpret market conditions?
Yes. The AI Insights feature reads the live market internals — indices, breadth, volatility (VIX), credit spreads and intermarket ratios like tech versus staples (XLK/XLP) — and generates a plain-English summary with an overall stance and the key levels to watch. It is available on the Market Internals and TLMM dashboards and refreshes on demand.
Related reading
See it on live market data
Start free and explore market breadth with real-time data.