Feature
Relative Strength Analysis
Relative strength ranks a stock against the rest of the market so you trade the leaders, not the laggards. TradersLab rates stocks, sectors and themes by strength versus the market and lets you screen for the highest-ranked names in one click.
Rank stocks by strength versus the market
Relative strength answers a simple question: is this stock outperforming the market, or lagging it? TradersLab's Relative Strength filters rank each stock against the market using single-timeframe RS Ratings over 1-month, 3-month, 6-month and 1-year windows, plus a Composite RS Rating that blends those four horizons into one score.
For a more opinionated read, Alex's proprietary RS Rank combines the multi-timeframe ratings with how far a stock sits from its 52-week high and low, so names that are both strong and pushing toward new highs rise to the top. It shows up as a dedicated RS Rank column in the screener, so screening for a high Composite RS Rating or RS Rank surfaces the market's outperformers instead of leaving you to eyeball hundreds of charts.
Watch leadership move with the Racing Chart
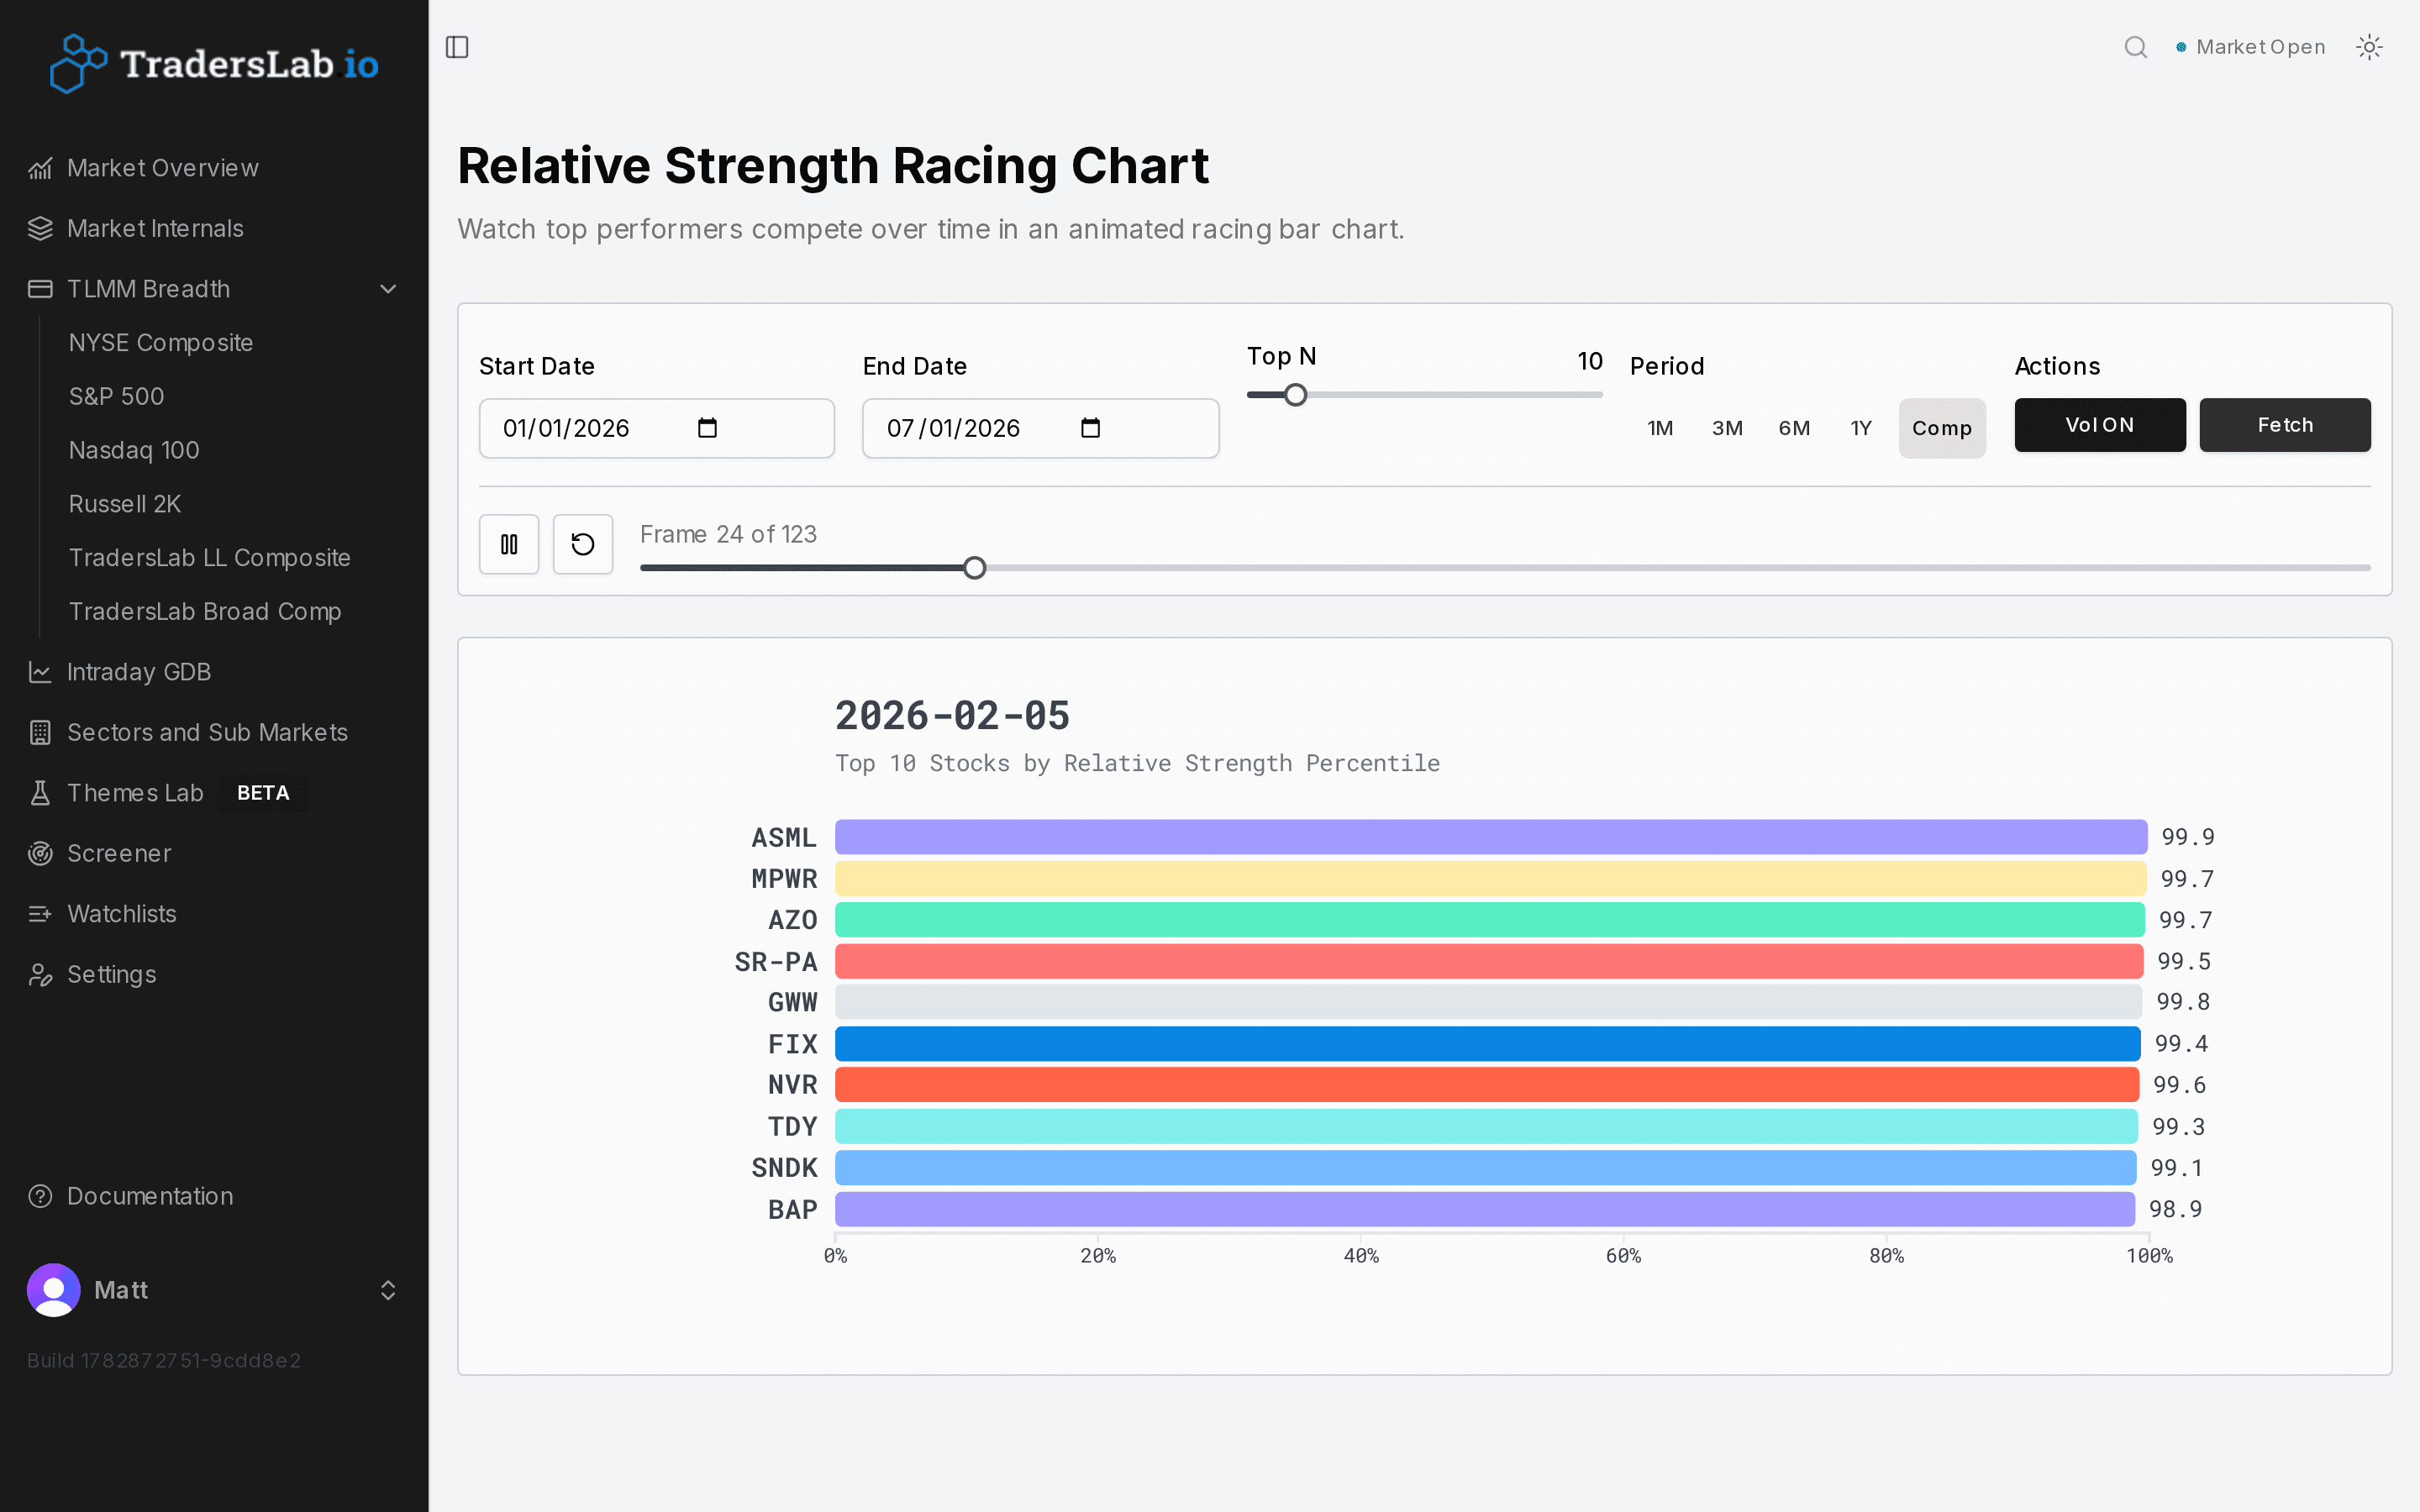
The Relative Strength Racing Chart turns the rankings into an animated bar race: it ranks stocks by their relative-strength percentile and plays the ranking forward over time, so you literally watch names climb and fall through the Top-N — a Top 10, for example — as leadership rotates.
Because it animates the percentile ranking rather than freezing a single day, the racing chart makes emerging leaders and fading names obvious at a glance, then hands off to the screener and the Sectors view for the detailed follow-up.
See strength across sectors, not just single stocks
Relative strength isn't only a stock-by-stock metric. The Sectors and Sub Markets dashboard ranks whole groups — broad sectors like Technology and Energy, and market-cap sub-markets from Mega-Cap down to Micro-Cap — using a volatility-adjusted relative-strength ranking, so a steadier group isn't outranked by a more erratic one purely on raw performance. A radar chart on each group shows its relative-strength rank across several timeframes at a glance. For narrower, narrative-driven groups — like AI Infrastructure or Memory — Themes Lab applies the same relative-strength ranking one level more granular than sectors.
That top-down view keeps you on the right side of rotation: strong groups rise to the top of the rankings and weak groups sink, and the leader lists point straight to the individual names carrying each strong group. A return-distribution visual confirms whether strength is broad across a group's members or concentrated in a single stock.
Turn the strongest names into a scan
Relative strength is most useful when it feeds the screener. Stack an RS filter on top of your other criteria — trend, market cap, sector, volatility — so every match is already a market outperformer, then watch the results counter to keep the list actionable.
From there, review matches as mini-charts or a table, and send the strongest candidates straight to a watchlist for ongoing tracking. The result is a focused list built around leadership rather than a broad, undifferentiated scan.
Who it's for
- Swing and momentum traders who want to trade the market's leaders rather than laggards
- Top-down traders who rank sectors and themes by strength before drilling into individual names
- Anyone who wants relative-strength ratings baked into their daily screens instead of chart-by-chart guesswork
Frequently asked questions
What is relative strength and why does it matter for trading?
Relative strength measures how a stock is performing versus the rest of the market. Strong relative strength points to the market's leaders — the names outperforming their peers — which are typically the best swing-trade candidates. TradersLab rates stocks, sectors and themes by relative strength so you can focus on leaders.
How does TradersLab rate relative strength?
The screener includes single-timeframe RS Ratings over 1-month, 3-month, 6-month and 1-year windows, a Composite RS Rating that blends all four, and Alex's proprietary RS Rank, which also factors in how far a stock sits from its 52-week high and low.
How do I find the strongest stocks in the market?
Add a Relative Strength filter to the screener and sort by a high Composite RS Rating or RS Rank. Every match is already a market outperformer, and you can stack it with trend, sector and volatility filters to narrow to your exact setup.
Can I rank sectors by relative strength, not just stocks?
Yes. The Sectors and Sub Markets dashboard ranks broad sectors and market-cap sub-markets by performance, with a radar chart showing each group's relative-strength rank across multiple timeframes so you can trade rotation toward the strongest groups. Themes Lab applies the same ranking to narrower, narrative-driven stock themes.
Related reading
See it on live market data
Start free and explore relative strength with real-time data.