Feature
Stock Screener for Swing Traders
TradersLab's stock screener scans the entire market in seconds. Stack filters like relative strength, trend, market cap, sector and 100+ criteria, then view matches as mini-charts or a data table and send the winners straight to a watchlist.
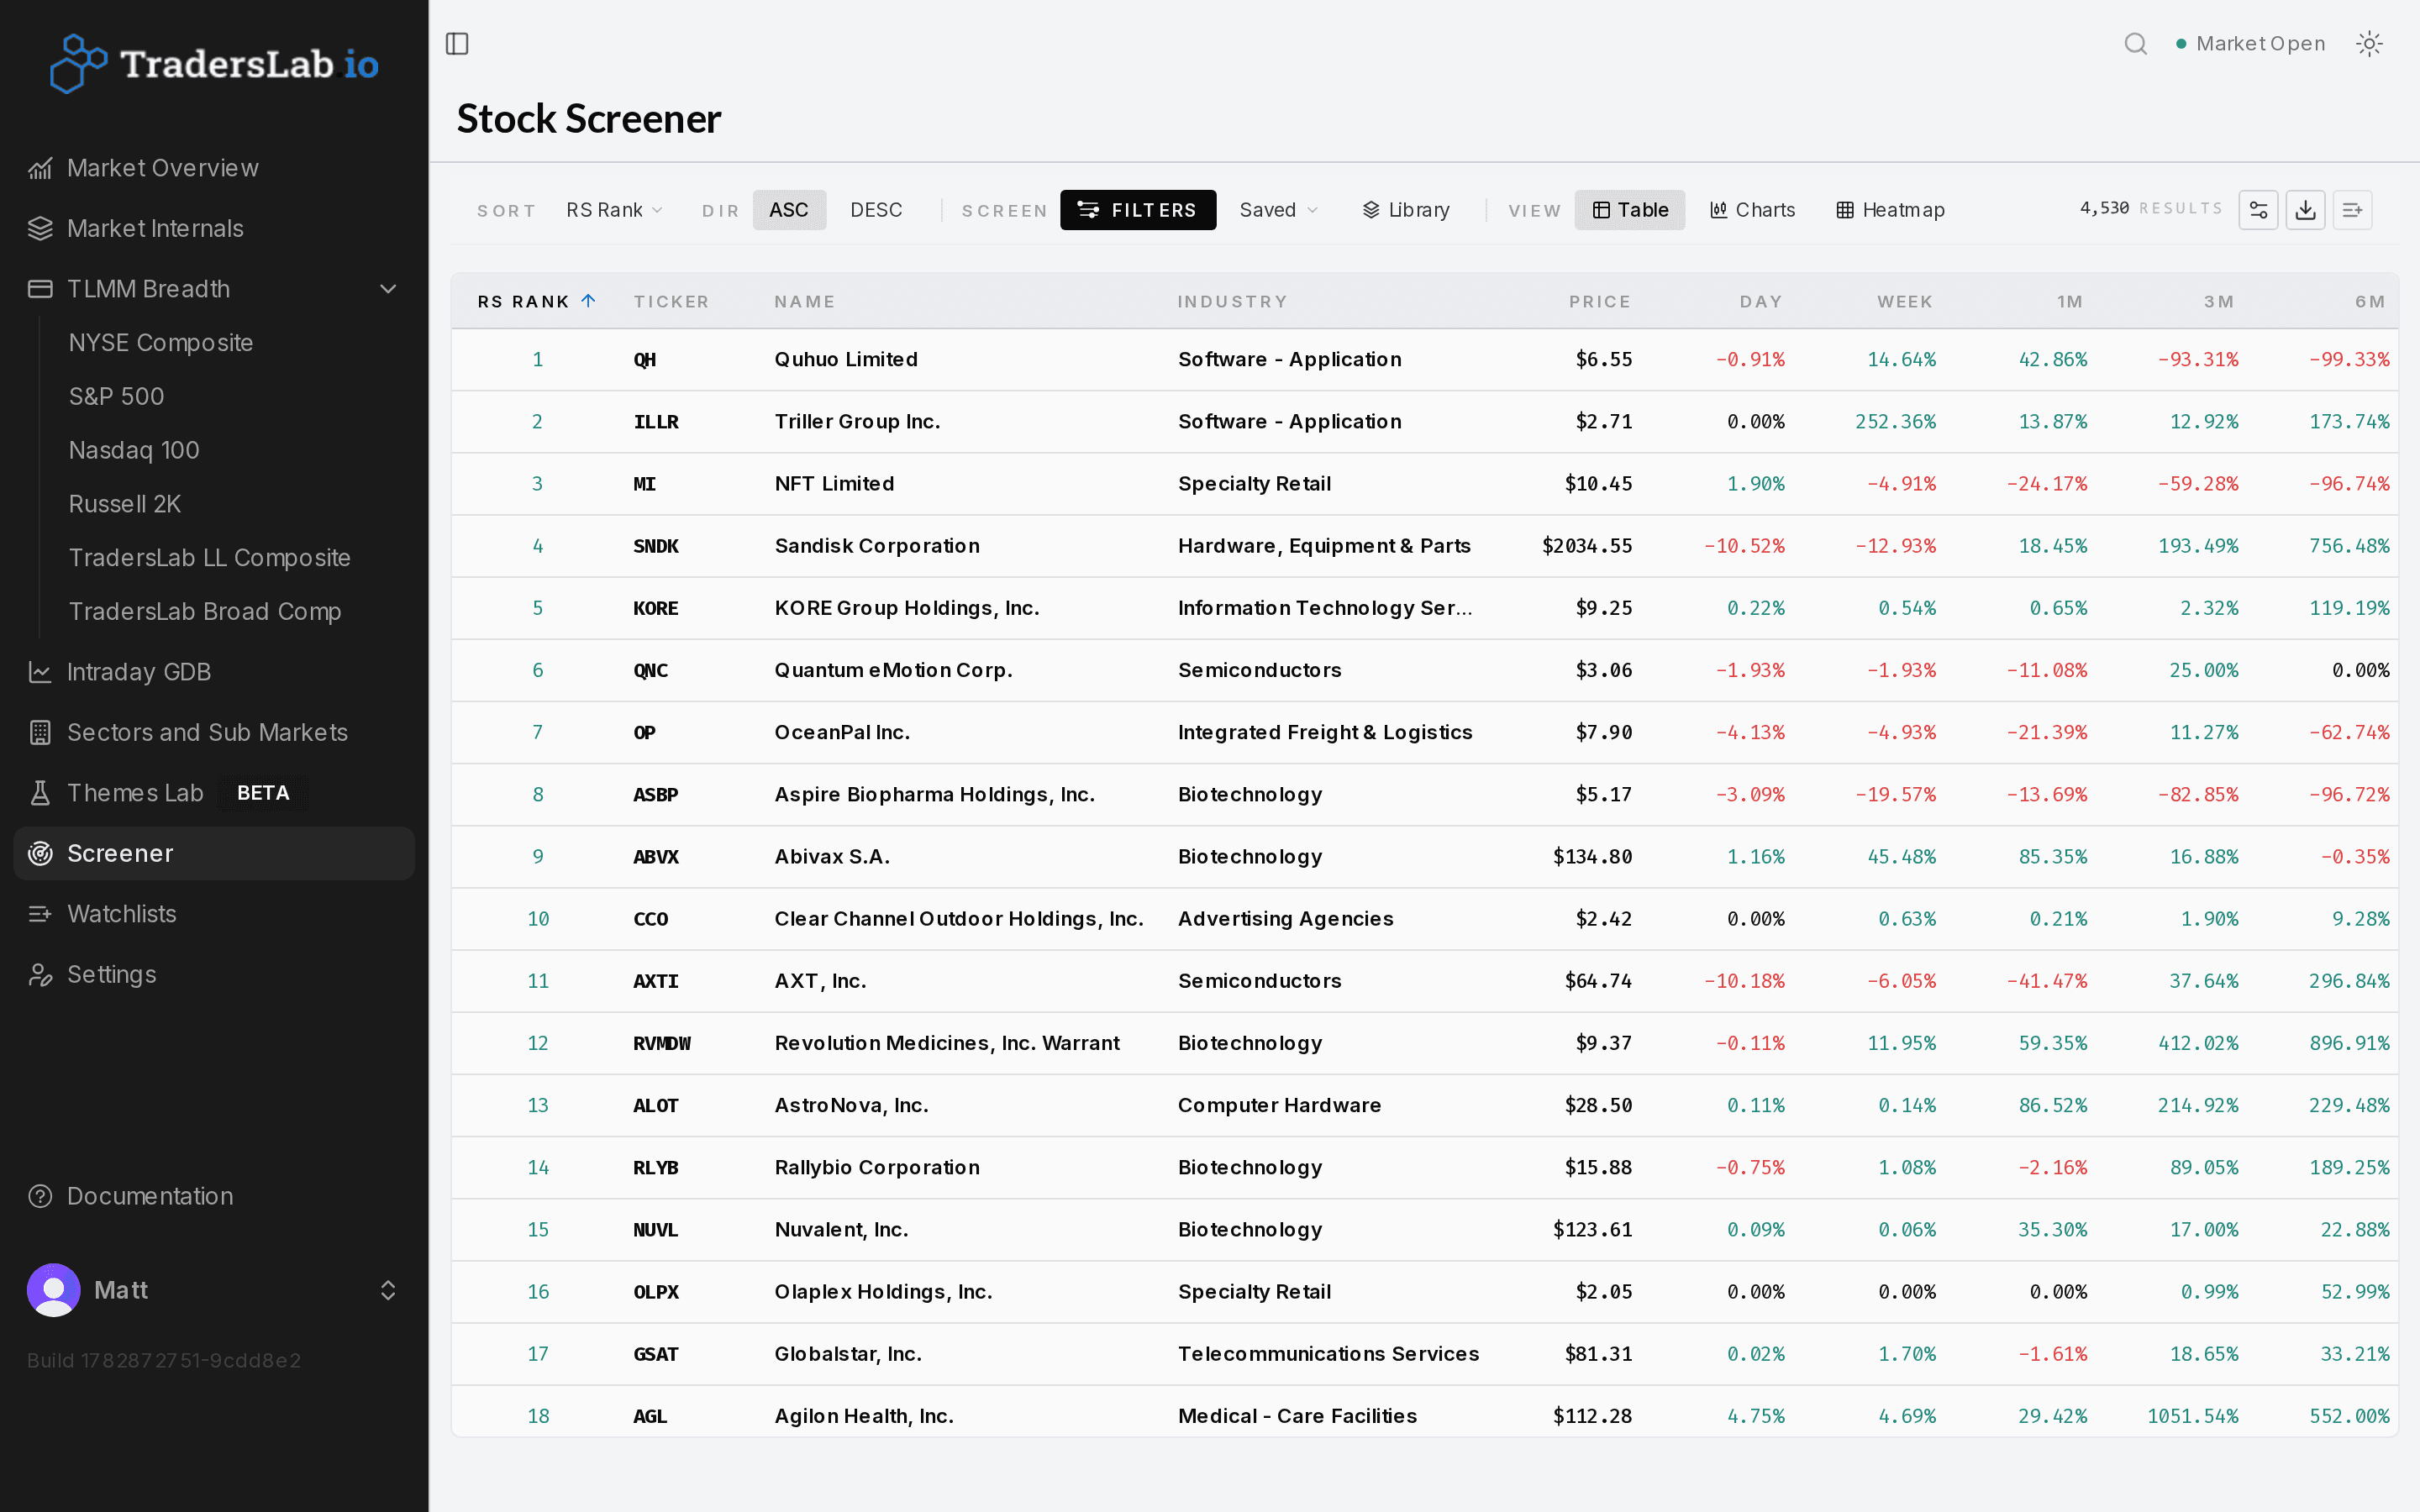
Scan the whole market in seconds
The screener is TradersLab's core scanning workspace. Choose a sort-by metric — price, volume, momentum and other predefined factors — and a direction to push the strongest performers or most extreme outliers to the top of the list.
The filters panel is the heart of the tool. Stack criteria such as market cap, price performance, sector and theme to narrow the universe down to specific setups. A running results counter shows how many securities currently match, so you instantly know whether a scan is too broad or too tight.
Charts view or table view
Toggle results between two views. Charts view renders every match as a mini-chart for fast visual interpretation, with selectable Daily, Weekly, Monthly, Weekly + Daily and Monthly + Weekly timeframes. Table view lays the same matches out in a spreadsheet-style grid for detailed cross-metric comparison.
When you find names worth tracking, send them to a new or existing watchlist in one click, or export the full list to CSV or Excel for outside analysis.
Build a screen in plain English with AI
Screener Assist is TradersLab's AI screen builder. Describe the setup you're after in plain English — "liquid momentum leaders within 25% of their highs", "software or semiconductors above the 50-day moving average", or a named style like Minervini, Qullamaggie or CANSLIM — and it assembles a complete screen for you, choosing the right filters and the correct AND/OR logic instead of making you build the filter tree by hand.
It explains the choices it made and lists its assumptions, so you see the reasoning rather than a black box, and you review and adjust every filter before applying it — nothing runs until you say so. You can also ask it to modify an existing screen in place.
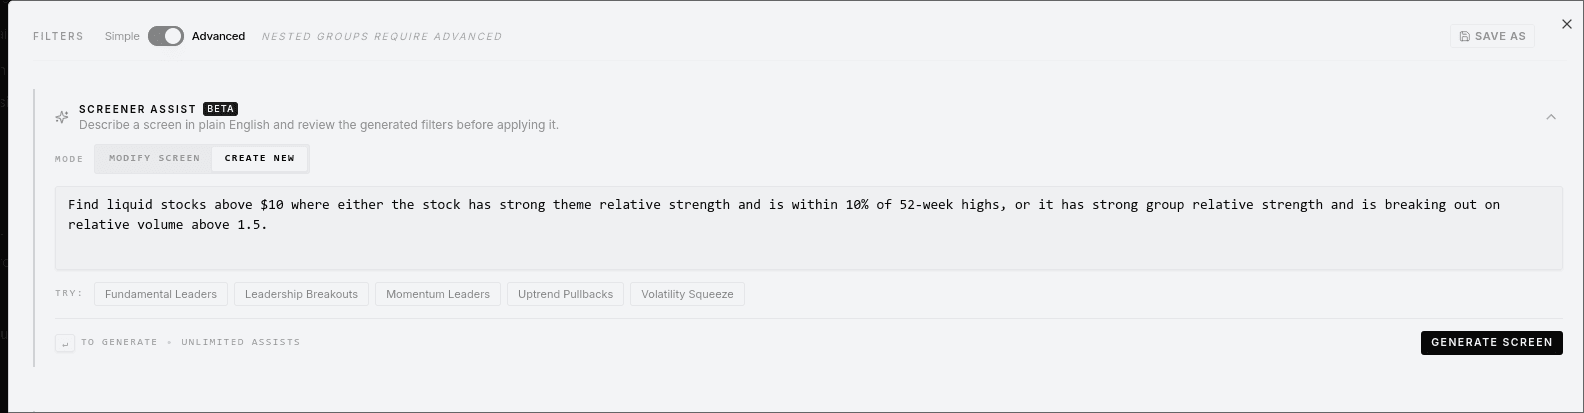
Save, reuse and share screens
Save a promising filter configuration to My Screens or Favorites so it can be re-run every day. The screener library also separates community-contributed screens and a curated Alex's Screens section, so you can borrow proven scans instead of building from scratch.
Search screens by keyword and sort them by name, most-recent update or favorite status to keep your daily workflow fast.
Who it's for
- Swing and momentum traders who scan the market daily for setups
- Traders who want reusable, saved scans they can run in seconds each morning
- Anyone who wants to borrow proven community or curated screens rather than build filters from scratch
Frequently asked questions
How do I use a stock screener to find trade setups?
Pick a sort-by metric and direction to prioritize the strongest candidates, then stack filters — market cap, price performance, sector, theme — to isolate your setup. Watch the results counter to keep the list actionable, review matches as mini-charts, and send qualifying names to a watchlist.
Can I save and reuse a custom stock screen?
Yes. Save any filter configuration to My Screens or Favorites and re-run it daily. You can also browse community and curated screens and pin the ones you use most.
Can I export screener results to CSV or Excel?
Yes. The screener exports matches to CSV or Excel, and can also send selected stocks directly to a new or existing watchlist.
What is the difference between the charts and table views?
Charts view shows each match as a mini-chart across selectable timeframes for fast visual scanning. Table view lays the same results out in a grid for detailed side-by-side comparison of exact numbers.
Can I build a stock screen using plain English?
Yes. Screener Assist, TradersLab's AI screen builder, turns a plain-English description of the setup you want into a complete screen — selecting the right filters and AND/OR logic for you. It explains its choices and lists its assumptions, and you review the generated filters before applying them.
Can the AI build a Minervini or CANSLIM-style screen?
Yes. Describe a named trading style — Minervini, Qullamaggie, CANSLIM or "momentum leaders" — and Screener Assist builds a practical starter screen for that approach, which you can tighten or adjust before running it.
Related reading
See it on live market data
Start free and explore stock screener with real-time data.