Feature
TLMM Market Timing Model
The TradersLab Market Model (TLMM) combines Price, Momentum and Breadth into one daily dashboard — anchored by a normalized -100 to +100 Global Daily Breadth (GDB) score — to tell you whether the market is in an uptrend, pullback, correction, rally or bottoming attempt, so you know when to be aggressive, cautious, or in cash.
Three pillars: Price, Momentum, Breadth
TLMM reads the health of the broad market from three components working together rather than any single indicator. Price is tracked through the 10-, 21-, 50- and 200-day moving averages and their crossovers — the 10/21 (short-term), 21/50 (medium-term) and 50/200 Golden Cross / Death Cross (long-term). Momentum is measured primarily through the 4% Up/Down Ratio: stocks up 4% or more divided by stocks down 4% or more on the day, where above 1 is bullish and below 1 is bearish, smoothed over 5- and 10-day windows to capture thrust or deterioration.
Breadth measures how broadly the market is participating using advances/declines, up/down volume, net new 52-week highs/lows, the McClellan Summation Index and Oscillator, and a Percent of Stocks Above Key Moving Averages panel spanning the 5-, 10-, 21-, 50- and 200-day averages. The McClellan Oscillator is the difference between the 19-day and 39-day EMAs of net advances — positive is bullish, negative is bearish — and curling up or down through its 10-day moving average can position you ahead of turns. The model only tracks assets that clear filters for average volume, float, liquidity, price and market cap, so the readings reflect tradeable stocks.
The Global Daily Breadth (GDB) score
All three pillars feed the Global Daily Breadth score — a weighted, standardized composite of daily price change, net advance/decline ratio, up/down volume ratio, net new 52-week high/low ratio and the 4% momentum ratio, normalized against the last year of readings onto a -100 to +100 scale. A reading above +80 is a Breadth Thrust (excessive buying); below -80 is Distribution (excessive selling).
Healthy uptrends tend to print steady GDB readings between +20 and +80. A thrust above +80 after a shallow pullback confirms upside continuation, but the same reading after an extended run can mark exhaustion. Once a pullback confirms, GDB should hold above -80 — a break below is a distribution warning. You can also read percent-above-21-EMA as an oversold/overbought gauge: below 25% is oversold and a buy candidate, above 75% is overbought and a top candidate (the 200 SMA reads long-term oversold/overbought the same way).
The Trend State Model
GDB drives the Trend State Model, which classifies the market top-down into five primary states based on which timeframes are positive: Uptrend (short, mid and long positive), Pullback (short negative, long positive), Correction (mid and long negative), Rally (short positive, long negative) and Uptrend Attempt (mid positive, long negative). That state tells you whether the environment favors buying, holding, trimming or waiting.
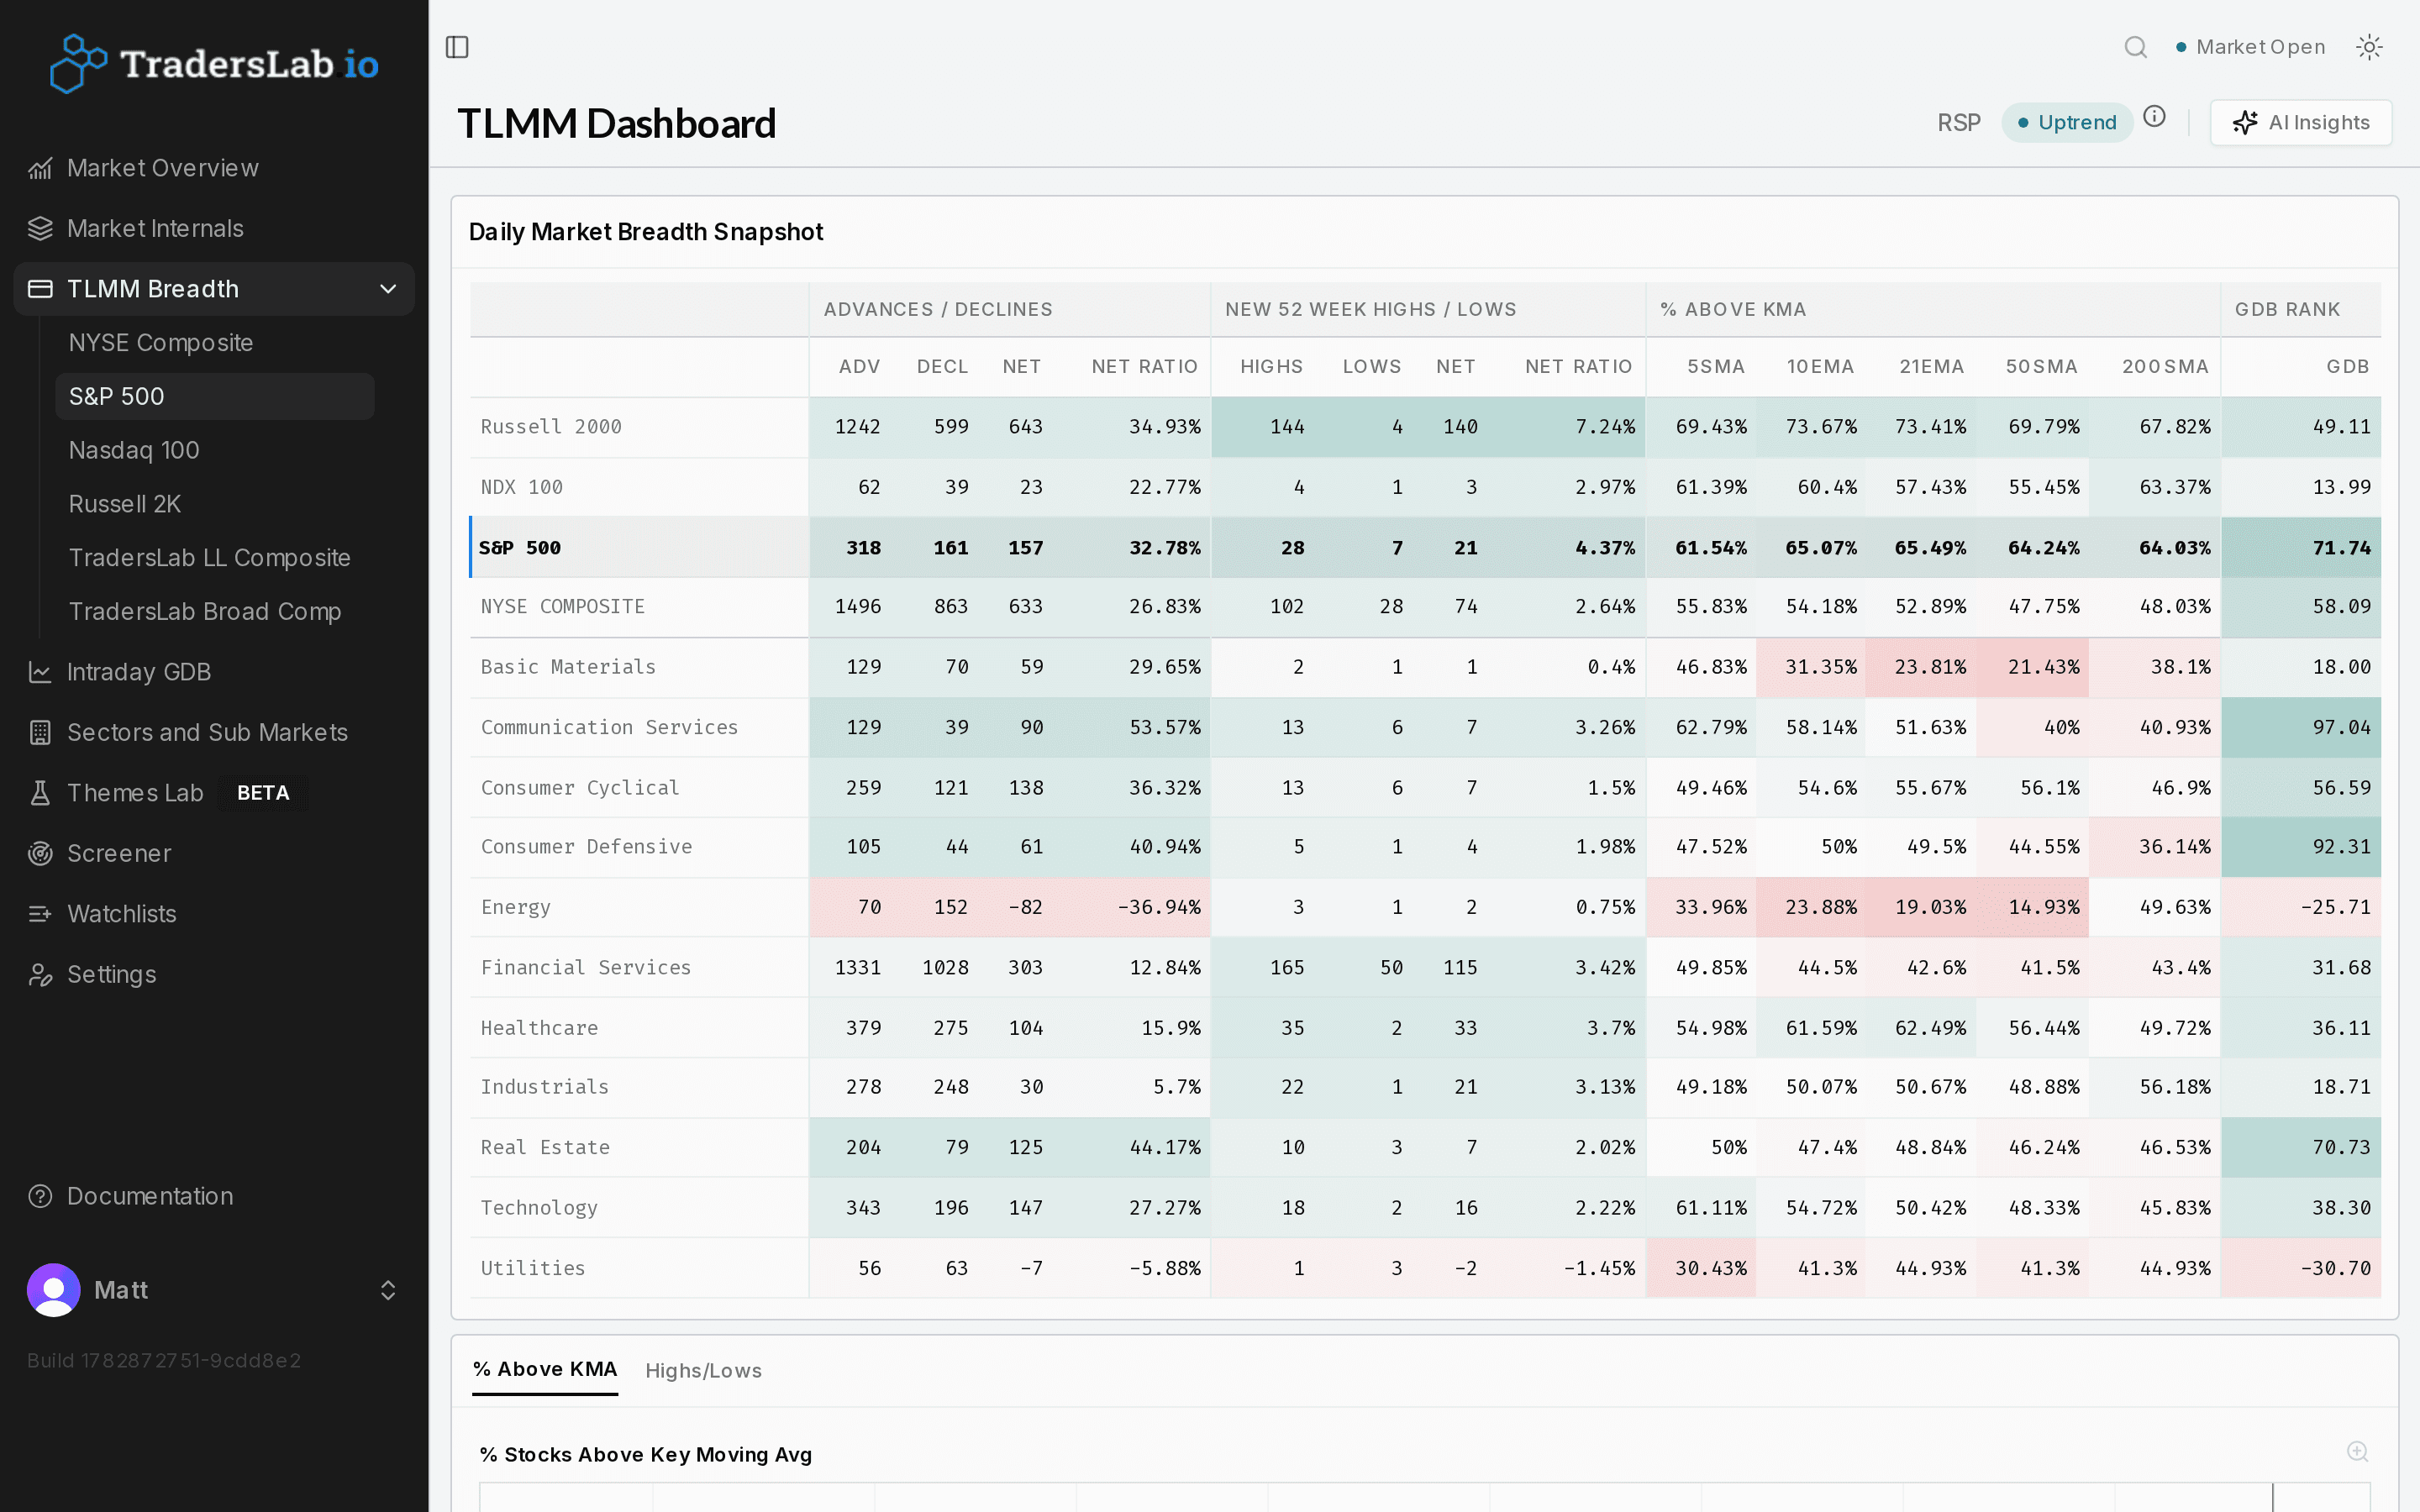
Each state pairs with actionable secondary signals. A Short-Term Buy fires in a Pullback when stocks above the 20/10-day MA fall below 25% and hook up more than 1%; a Long-Term Buy fires in a Correction when stocks above the 200/50-day MA fall below 25% with a 1%+ hook up. In a Rally, breadth above 75% with a 1%+ hook down flags Shorting; in an Uptrend the same setup flags Trimming. A Daily Market Breadth Snapshot repeats these reads for every market and sector so you can rotate toward the strongest or most oversold breadth.
Who it's for
- Trend and swing traders who time entries and exits with market internals
- Traders who want a rules-based read on market direction and health across short, medium and long timeframes
- Sector rotators who use per-sector breadth to find where strength is building
Frequently asked questions
What is the TradersLab Market Model (TLMM)?
TLMM is a daily breadth-based market-timing model that combines Price, Momentum and Breadth into a single dashboard. It is anchored by the -100 to +100 Global Daily Breadth score and a Trend State Model that classifies the market as an uptrend, pullback, correction, rally or uptrend attempt so you can set your bias before choosing trades.
How is the Global Daily Breadth (GDB) score calculated?
GDB is a weighted, standardized composite of daily price change, net advance/decline ratio, up/down volume ratio, net new 52-week high/low ratio and the 4% up/down momentum ratio. Those inputs are summed and normalized against the last year of readings onto a -100 to +100 scale.
What does a GDB reading above +80 mean?
A GDB above +80 is a Breadth Thrust — excessive buying. After a shallow pullback it confirms upside continuation, but after an extended uptrend it can mark exhaustion. A reading below -80 is Distribution, or excessive selling; healthy uptrends usually sit between +20 and +80.
What percent of stocks above the 21 EMA signals oversold or overbought?
Below 25% of stocks above the 21 EMA is oversold and a buy candidate; above 75% is overbought and a top candidate. The percent above the 200 SMA reads the same way for the long-term trend. Extreme readings paired with a 1%+ daily hook up or down are used to time entries and exits.
Related reading
See it on live market data
Start free and explore tlmm market timing with real-time data.