Feature
Commitment of Traders (COT) Dashboard
TradersLab's Commitment of Traders (COT) dashboard shows how the three groups of futures traders — commercial hedgers, large speculators and small traders — are positioned in each market, and how those positions have shifted across years of weekly CFTC reports.
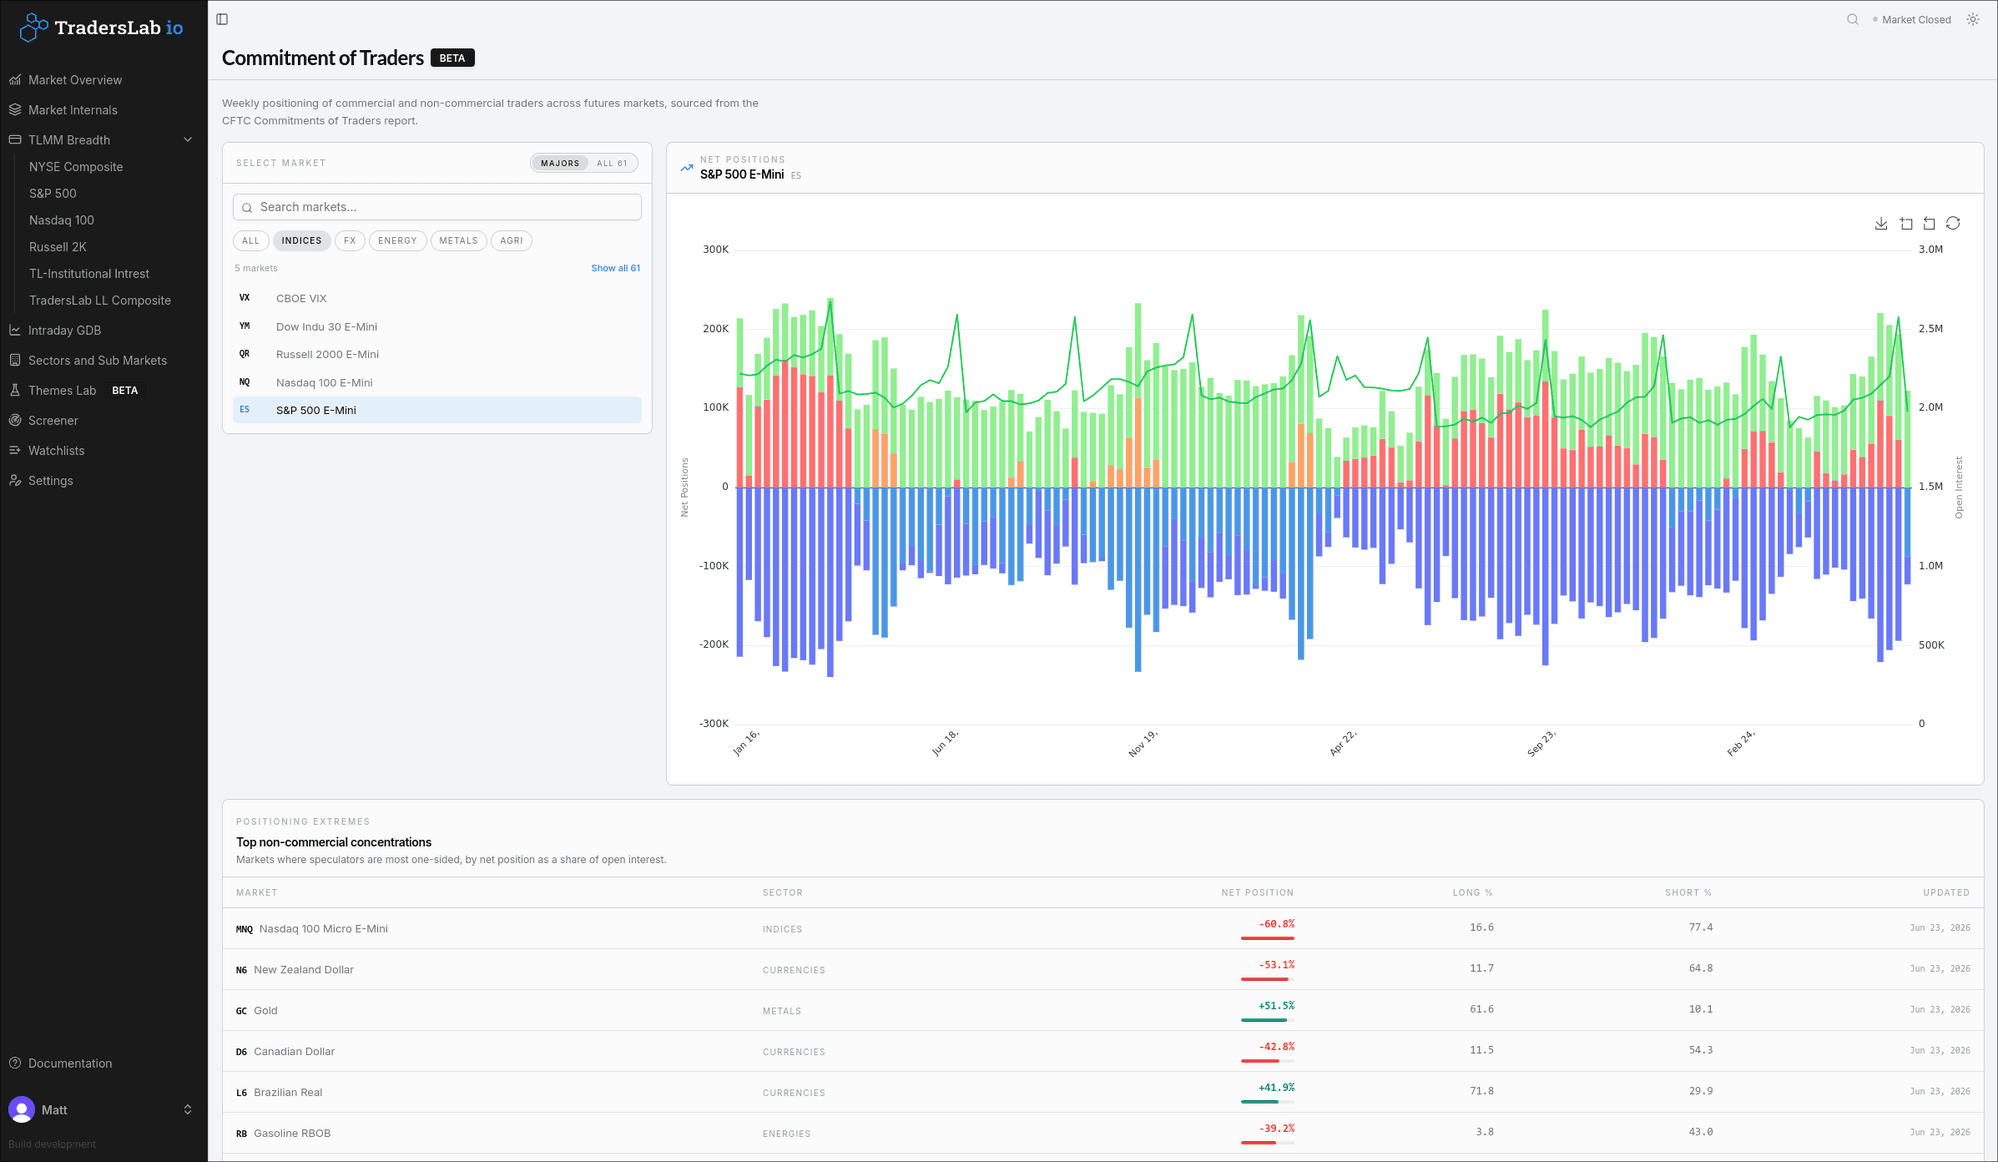
See who is really positioned in each market
Every futures market is a tug-of-war between three groups the CFTC tracks: commercial hedgers who trade the underlying (producers and end users), large non-commercial speculators (typically funds), and small non-reportable traders. The COT dashboard plots each group's net position — long contracts minus short contracts — as a stacked column for every week, so you can see at a glance who is net long, who is net short, and how conviction is building or unwinding.
An open interest line runs across the same chart, so a shift in positioning is always read against whether total participation in the market is rising or falling. Years of weekly history let you judge whether today's positioning is normal or stretched versus the market's own range.
Spot positioning extremes across 60+ markets
The concentration table ranks markets by how one-sided large speculators are — net non-commercial position as a share of open interest — surfacing where the crowd is most heavily long or short right now. Alongside it you get each market's long % and short % of open interest and the report date, so the most crowded trades rise to the top.
Coverage spans 60+ US futures across equity indices, currencies, energy, metals, interest rates, grains, softs and meats. A curated majors view keeps the most-watched markets one click away, and a single toggle expands to the full universe when you want to dig deeper.
Built around the weekly CFTC release
COT data is published by the CFTC once a week — released each Friday afternoon, reflecting positions held the prior Tuesday. TradersLab pulls that report for every covered market and does the work of computing net positions, positioning-as-share-of-open-interest and the week-over-week picture, so you can read the story instead of assembling spreadsheets.
Select any market to chart its full multi-year positioning history, zoom into a stretch of interest, and compare how commercials and speculators have traded around past turning points.
Who it's for
- Futures and commodities traders who want to see commercial versus speculative positioning before taking a trade
- Macro and swing traders who use crowded positioning as a contrarian or confirmation signal
- Anyone tracking how hedgers and large funds are positioned across indices, currencies, energy, metals and grains
Frequently asked questions
What is the Commitment of Traders (COT) report?
It is a weekly report from the U.S. Commodity Futures Trading Commission (CFTC) that breaks down open futures positions by type of trader — commercial hedgers, large non-commercial speculators, and small non-reportable traders — for each covered market.
What is the difference between commercial and non-commercial traders?
Commercials are hedgers who deal in the underlying asset (producers and end users) and often trade against the trend to offset real exposure. Non-commercials are large speculators, typically funds, who tend to follow trends. Non-reportable traders are small accounts below the CFTC's reporting thresholds.
Which markets does the COT dashboard cover?
More than 60 US futures markets across equity indices, currencies, energy, metals, interest rates, grains, softs and meats — with a curated majors view and a one-click toggle to the full list.
How often is COT data updated?
Weekly. The CFTC releases the report every Friday afternoon, reflecting positions as of the prior Tuesday, and the dashboard reflects each new release.
How do I find where speculators are most one-sided?
The concentration table ranks markets by net non-commercial position as a share of open interest, so the most crowded long or short trades surface at the top with their long % and short % of open interest.
Related reading
See it on live market data
Start free and explore commitment of traders with real-time data.